

This Week’s Focus: RTR’s Benefits and Drawbacks
Founded in 2009, Rent the Runway started off as a stylish, one-time rental service for special-occasion clothing. However, its evolution into a subscription-based primary wardrobe provider increased the company’s operational complexity impacting its ability to scale. This week, we revisit RTR as a case study on how a differentiated, highly personalized service can attract loyal customers and significant revenue yet still struggle to scale profitably. The company’s challenge lies in balancing innovation with efficiency while trying to grow its pool of subscribers rather than extracting more value from its existing users.
Many of my readers are also former students, so hopefully they remember that somewhere in my first class, I discuss Rent The Runway (RTR)—whether they think it can work, and whether it can scale. The right answer is: “Yes, of course we remember!”
Founded in 2009, RTR offers a solution for special occasion dressing, without the special occasion price tag! Most students find that while there is clear demand for such a service, the complexity of the business may make it difficult to scale.
I haven’t followed the firm much these past few years, so I was shocked a few days ago to see that its market cap is around $23M.

The company’s financial trajectory reveals a business caught between two imperatives: the need to offer sophisticated services that differentiate it from competitors, and the requirement to achieve operational efficiency at scale.
Time to see what’s really hanging in the closet.
Financial and Operational Analysis: Balancing Growth and Profitability
RTR’s financial trajectory illustrates the complexities and challenges of scaling a subscription-based fashion rental service. The company’s revenue, driven by strong subscriber growth, peaked in 2019 at $256.9 million. However, the COVID-19 pandemic had a severe impact, causing a sharp decline (39%) to $157.5 million in 2020. While the subsequent recovery has been substantial—$298.2 million in 2023—growth has stalled, increasing by only 0.6% year-over-year since 2022. Fiscal 2024 kept the same pattern: revenue inched up another 2.7% to $306.2 million, buoyed by a modest Q4 finish, but still far below the double-digit expansion once expected for a company of RTR’s scale.

Net losses have consistently stayed above $100 million annually, but the bleed is narrowing—from exceeding total revenue in 2020–21 to 38% of revenue in 2023, and, based on preliminary 2024 guidance, down to roughly 32%, as steady gross-margin gains (near 40%) help offset modest cost increases. Those same efficiencies boosted Adjusted EBITDA from its first positive result of $6.7 million in 2022 (a 2.3% margin) to $26.9 million in 2023 (9.0%), and—according to management—into the low-to-mid $30 million range for 2024. It’s an impressive trajectory—until you remember the ‘Adjusted’ in ‘Adjusted EBITDA,’ a caveat we’ll return to shortly.
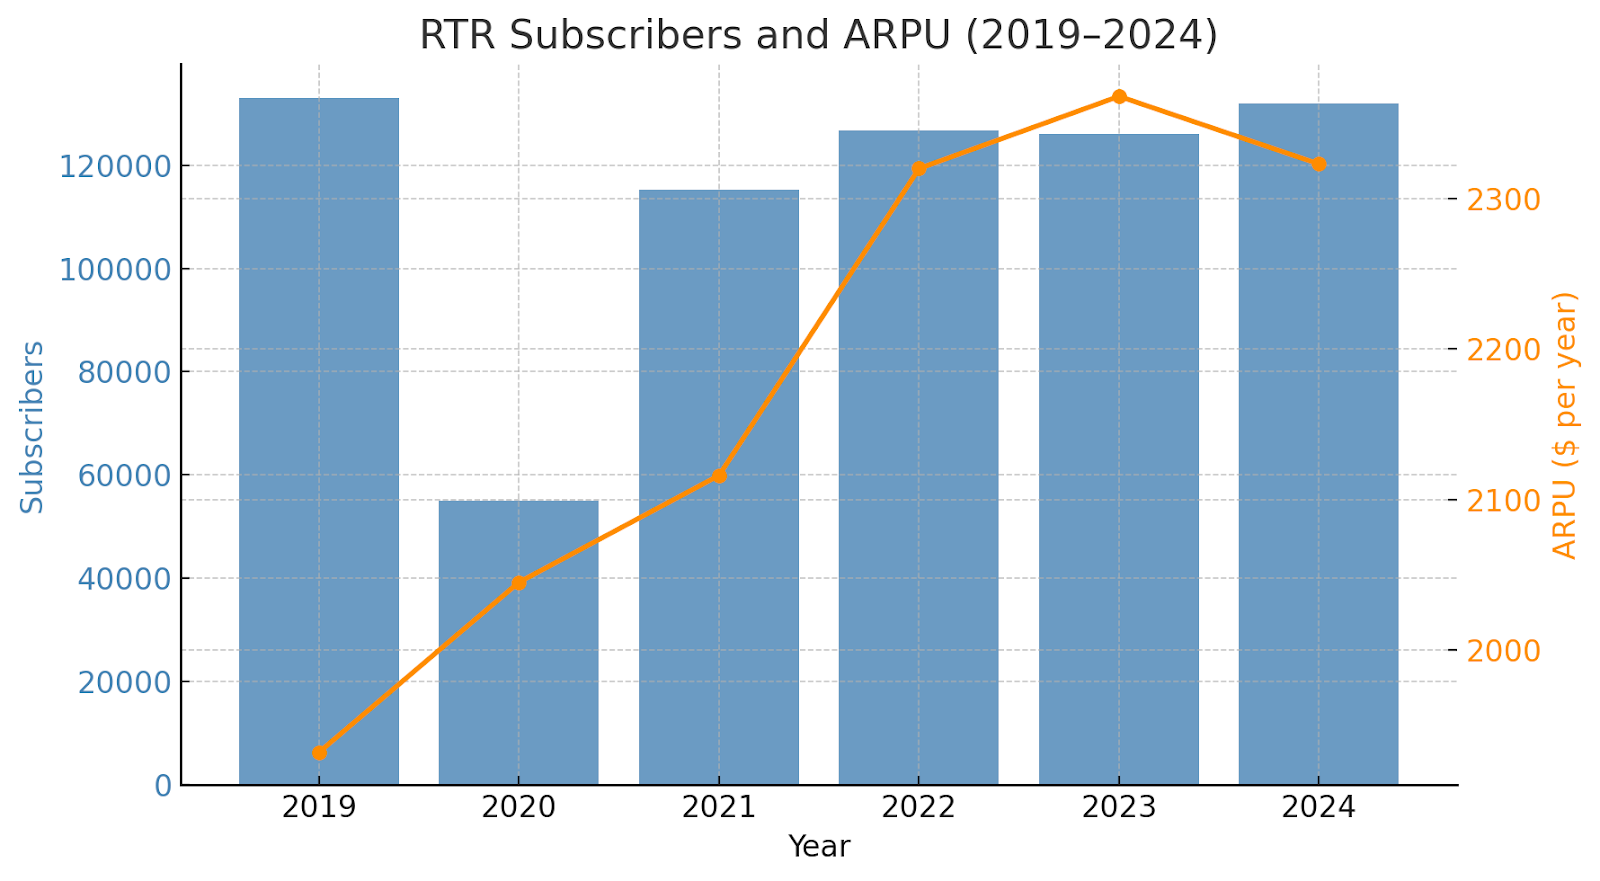
Furthermore, the subscriber trajectory still signals headwinds. After plunging from about 133K to just 55K between 2019 and 2020, the base rebounded to approximately 126K in 2023 and is projected to reach roughly 132K in 2024—still meaningfully lower than pre-pandemic highs. Meanwhile, annual revenue per subscriber (ARPU) climbed from $1,932 in 2019 to $2,368 in 2023, before easing slightly to an estimated $2,323 in 2024 as modest pricing tweaks and a flatter mix offset the incremental subscriber growth.
The picture remains one of extracting more value from the same customer pool rather than accelerating new-user adoption—an approach that may bump into structural limits given RTR’s operational complexity.
Unit Economics: Navigating the Razor’s Edge
RTR’s unit economics highlight the critical importance of operational efficiency. The company’s depreciation methodology significantly affects reported profitability.
RTR depreciates its rental products over 2-3 years with minimal residual value. For instance, a $500 designer dress, assuming a 36-month lifespan and $50 residual value, results in an annual depreciation of $150. However, under a conservative scenario (24-month lifespan with zero residual), depreciation jumps to $250 annually—a 67% increase. This sensitivity is critical.
A mere 20-30% higher depreciation could severely reduce Adjusted EBITDA margins, potentially eradicating profitability altogether—RTR’s current 9% EBITDA margin ($27 million) could fall to just 4% ($12 million) under moderately adverse assumptions.
RTR has improved inventory utilization significantly, boosting lifetime revenue per item from $445 in 2019 to $536 in 2021—a 20.4% increase that improved return on investment from approximately 4x to 6x. With rental prices averaging $25-$30 per use and item costs between $85-$90, achieving breakeven requires 17-18 rentals per garment. RTR’s target of approximately 20 rentals per item provides only a narrow margin for profitability (10-15%), illustrating the fragile nature of its unit economics.
Similarly, subscriber economics reveal the balance RTR must maintain. Although ARPU increased from $161 monthly to $197 between 2019 and 2023, high customer acquisition costs—ranging between $150-$200 per subscriber—place significant pressure on the customer lifetime value and customer acquisition ratio (LTV/CAC). The flat subscriber growth observed in 2023 and 2024, despite improved ARPU and customer satisfaction metrics (20-point increase in Net Promoter Score), indicates possible market saturation or unsustainable customer economics.
RTR’s ongoing struggle to achieve sustained profitability and subscriber growth highlights the interplay between operational complexity, scalability, and market constraints. While significant operational efficiencies have improved margins and financial discipline, the company’s narrow unit economics and stagnating subscriber base highlight fundamental scalability challenges. RTR’s future viability rests heavily on its ability to expand its subscriber base efficiently while carefully managing operational costs and complexities.
Operational Infrastructure: The Evolution of Complexity
RTR’s operational infrastructure represents both its greatest asset and its heaviest burden. The company operates what it claims is “the world’s largest dry cleaning operation,” processing thousands of returned items daily through a sophisticated reverse logistics system. This infrastructure includes two major fulfillment centers: the original “Dream Fulfillment Center” in New Jersey and a 300,000-square-foot automated facility in Texas.
Yet this infrastructure comes with significant fixed costs and operational risks. A well-publicized tech glitch in the Fall of 2019 caused a backlog that forced RTR to temporarily freeze new subscriptions—a reminder that complexity can create cascading failures. The company has since invested in technology resilience, including cloud migration in 2022, but the incident highlighted how operational complexity can undermine growth at critical moments.
RTR has also innovated in last-mile logistics, launching at-home pickup services in 30+ markets and offering “live swaps” where deliveries simultaneously collect returns. These services improve customer experience but add layers of coordination and costs that traditional retailers don’t face.
RTR’s complexity didn’t emerge overnight—it accumulated through strategic decisions aimed at capturing more customer value. The company began with a relatively simple model: rent a designer dress for a special event, wear it once, and return it. Essentially, a fashion lending library with straightforward operations and clear unit economics. Complex, but still manageable.
The pivot to subscription services in 2016 marked the beginning of RTR’s complexity journey. The “Unlimited” subscription transformed the company from an occasional rental service into a primary wardrobe provider. Suddenly, RTR had to manage continuous exchanges, with power users swapping dozens of items monthly. This shift required fundamental changes to every aspect of the business: inventory management became dynamic rather than episodic, logistics transformed from simple point-to-point shipping to continuous circulation, and customer service evolved from transaction support to relationship management.
By 2019, RTR operated multiple business lines simultaneously: subscriptions (accounting for over 80% of revenue), one-time rentals, physical showrooms in major cities, and partnerships with brands. Each addition brought strategic benefits, which were inevitably paired with operational challenges. The physical stores, for instance, provided try-on experiences and convenient returns but proved to be loss leaders that were shuttered during the pandemic.
The pandemic forced a reckoning with this complexity. With unprecedented cancellations and the closure of all physical locations, RTR had to strip back to essentials. The discontinuation of the “Unlimited” plan in favor of tiered subscriptions (4, 8, 12, or 16 items per month) represented a strategic simplification that improved unit economics as the strain from super-users driving disproportionate logistics costs was reduced significantly.
Estimating the Cost of Complexity
Rent the Runway’s business may look deceptively simple, yet the underlying economics are burdened by layers of fashion‑specific complexity that don’t exist in standard sharing‑economy models. Garments age quickly (fabric fatigue, zipper failures, dry‑cleaning wear) and, unlike cars or apartments, they become socially obsolete as soon as trends shift. Seasonality compounds the problem: a red velvet holiday dress (hot in December) has little value in July, forcing RTR to carry deep yet perishable inventory. Finally, every style must be stocked in a size curve (0–22) even though demand is highly skewed toward the middle; the slow‑moving edge sizes drag down overall utilization. These realities make it impossible to reach the coveted “20 rentals per item” often cited in early investor decks.
Because RTR does not disclose actual turns, we triangulate them using three independent methods and show how rising complexity eats away at the theoretical economies of scale.
Subscriber‑based inference: RTR discloses active subscribers and average monthly revenue per subscriber (ARPU ≈ $197 in 2023, or $2,368 annually). A typical 8‑item plan costs about $159 per month, implying an effective revenue per rental of roughly $30 once pauses, add‑ons, resale revenue and promos are netted out. Dividing annual ARPU by $30 suggests each subscriber triggers ≈ 80 rentals a year. To guarantee choice, RTR keeps a pool of roughly eight physical items per active subscriber (derived from S‑1 inventory disclosures and later management commentary). Combining the two figures yields an implied inventory‑turn metric:
Turns ≈ Annual rentals ÷ Inventory units = (80 × subscribers) ÷ (8 × subscribers) ≈ 10. This allows us to estimate the complexity penalty: every extra size or season‑specific item raises the denominator but not the numerator, pushing turns below 10.
Revenue‑to‑book triangulation: RTR carries rental assets on its balance sheet at cost and depreciates them over 36 months with near‑zero residual value. In fiscal 2023 the company recorded $107M of cost‑of‑rental product depreciation against a year‑end gross rental asset base of roughly $300M—an implied physical churn of 35 % per year. If each item depreciates linearly over three years, the asset pool represents ≈ three vintages of inventory, and one vintage (∼ $100M worth) must be replaced annually. Mapping replacement spending to cost‑per‑item (∼ $90 wholesale equivalent) implies 1.1 million units in circulation. Plugging the earlier revenue‑derived rental count (∼10–11 million rentals) into this denominator gives 9–10 turns per year, aligning with subscriber‑based inference.
Utilization‑curve back‑solve: RTR’s S‑1 included a cohort chart showing lifetime revenue per item rising from $445 (2016 buys) to $536 (2018 buys). Using the mid‑point ($490) and dividing by the $30 revenue‑per‑rental figure implies ≈ 16 lifetime rentals. Management also cites a three‑year economic life, so dividing 16 by 3 suggests 5–6 turns a year after accounting for early retirements and damage write‑offs. This bottom‑up method, which embeds real‑world attrition, puts a lower bound on achievable turns.
All three lenses converge on a 5–11 turn band—well below the theoretical 20. The table combines public inputs (subscribers, revenue) with the $30 rental‑yield assumption to give a year‑by‑year view:
The 2020 spike was driven by the fact that RTR slashed inventory purchases during the pandemic faster than subscriber cancellations, temporarily boosting turns. As the business rebuilt its closet, it settled into a 9–10 range despite revenue growth, illustrating how complexity absorbs scale. Each incremental subscriber brings revenue, but also demands breadth (more styles, full size curve), so the denominator grows almost in lock‑step with the numerator.
Let’s estimate the cost of complexity. Turns translate directly into capital employed (cash tied up in garments) and non‑cash expense (garment depreciation rate through the income statement). The relation is simple:
Inventory units = Annual rentals ÷ Turns
Capital tied up = Inventory units × Cost per unit
Annual depreciation ≈ (Inventory units × Cost per unit) ÷ Useful life
To make the numbers tangible I fix four publicly grounded inputs:
Annual rentals ≈ 10 million (from the $30 revenue‑per‑rental yield on $298M 2023 revenue).
Cost per unit ≈ $90 (company’s blended acquisition cost disclosed at IPO).
Useful life = 3 years (management guidance; straight‑line).
Baseline turns = 10.
Baseline capital: 10 m rentals ÷ 10 turns → 1 m units × $90 = $90 m gross book. Depreciation therefore runs $90 m ÷ 3 = $30 m per year.
What if operational tweaks—better forecasting, tighter style curation—increase turns to 12? Improved scenario: 10M ÷ 12 = 0.83 m units. Capital falls to $75Mm and depreciation to $25M. $15M of cash is liberated upfront and $5M of annual expense disappears. Relative to 2023’s $27M Adjusted EBITDA, the depreciation relief alone boosts operating margin by nearly +2 pp; the capital release could fund an entire year of growth marketing.
Conversely, if trend volatility or size skew drags turns down to 8, required inventory rises to 1.25M units, tying up about $22M in additional working capital and adding roughly $7.5M in annual depreciation—enough to shave away more than a quarter of 2023’s $27M Adjusted EBITDA, a stark reminder of how complexity silently taxes scale.
Every additional subscription tier, seasonal capsule, or fringe size inflates the denominator of the Turn equation. Because demand—numerator—grows slower, the net effect is margin dilution.
The strategic levers are clear: prune SKU breadth, push brand partners toward “Share by RTR,” and redirect demand toward high‑yield items to lift turns. Absent a sustained improvement in inventory productivity, RTR’s logistics stack will keep running in place—busy, but not compounding.
Path to Profitability: A Narrow Window
RTR’s growth limitations become clear through market analysis. With an estimated Total Addressable Market of 10-15 million potential subscribers (women aged 25-45 with household income above $75,000), RTR’s current 125,954 subscribers represent just 0.8-1.3% penetration. To reach $3 billion in revenue—a typical threshold for sustainable public companies—RTR would need to either triple revenue per subscriber or 10x its subscriber base.
Competitive pressures intensify the challenge. Traditional retailers like Nordstrom and Bloomingdale’s have launched rental services. Digital natives like Stitch Fix offer subscription models without rental complexity. Resale platforms like ThredUp and Poshmark capture similar sustainability-minded consumers with simpler operations.
The hiring of a new CMO and increased marketing spend in 2024 acknowledge acquisition challenges. Yet throwing money at growth rarely solves fundamental model issues. RTR must balance growth investment against debt service requirements and the need to reach cash flow breakeven.
RTR’s path to profitability requires threading a narrow needle (no pun). If the firm aims to break even on free cash flow by the end of 2025, management should target the following:
Revenue growth: 1-6% (limited by market saturation)
EBITDA margin expansion to ~15% (600 basis points improvement)
Inventory capex: <$50 million (debt covenant constraint)
Marketing spend: Capped (debt covenant constraint)
The math is challenging. With interest payments resuming soon (after current deferral), RTR needs approximately $30 million additional EBITDA just to cover interest—implying 20% EBITDA margins on current revenue. This requires either dramatic operational improvements or significant revenue growth, which are both difficult considering current constraints.
Lessons in Scaling Complex Operations
RTR’s journey offers several critical insights about scaling complex businesses:
Complexity compounds faster than revenue scales. Each new service, partnership, or operational innovation adds multiplicative rather than additive complexity. RTR’s evolution from dress rentals to full wardrobe subscriptions, resale, multiple fulfillment centers, and brand partnerships created interdependencies that make scaling exponentially harder.
Operational excellence becomes existential. Unlike simple businesses where modest inefficiencies are tolerable, complex operations can quickly spiral into crisis. RTR’s 2019 fulfillment breakdown shows how a single point of failure can threaten an entire business model.
Unit economics must account for complexity costs. RTR’s improving gross margins and EBITDA suggest progress, but these metrics may not fully capture the hidden costs of complexity: management attention, system integration, error rates, and the need for continuous innovation to maintain a competitive advantage.
Simplification can unlock scale. RTR’s pandemic-driven changes—closing stores, ending unlimited subscriptions, focusing on digital—improved economics. Sometimes scaling requires removing complexity.
Capital efficiency matters more than growth. RTR’s shift to consignment inventory and revenue-sharing models shows how structural innovations can improve scalability more than pure growth initiatives.
Conclusion: The Complexity-Scale Balance
Rent the Runway represents a fascinating case study on the tensions between innovation and efficiency. The company’s complex operations enable a unique value proposition that has attracted hundreds of thousands of subscribers and hundreds of millions in revenue, yet it has also hindered the firm’s ability to achieve the profitability that simpler business models might deliver.
The key lesson is that complexity itself is neither good nor bad. Complex and difficult things are what create moats, but also taxes economies of scale—both a differentiator and a burden.
The company’s future depends on finding the optimal balance: enough complexity to maintain a competitive advantage, but not so much that it prevents scaling.
As always, great analysis! I was wondering if RTR subscriber growth has anything to do with Shein (cheap fashion), generally younger population having limited money and them not much caring about designer clothes?